This site uses cookies to improve your experience. To help us insure we adhere to various privacy regulations, please select your country/region of residence. If you do not select a country, we will assume you are from the United States. Select your Cookie Settings or view our Privacy Policy and Terms of Use.
Cookie Settings
Cookies and similar technologies are used on this website for proper function of the website, for tracking performance analytics and for marketing purposes. We and some of our third-party providers may use cookie data for various purposes. Please review the cookie settings below and choose your preference.
Used for the proper function of the website
Used for monitoring website traffic and interactions
Cookie Settings
Cookies and similar technologies are used on this website for proper function of the website, for tracking performance analytics and for marketing purposes. We and some of our third-party providers may use cookie data for various purposes. Please review the cookie settings below and choose your preference.
Strictly Necessary: Used for the proper function of the website
Performance/Analytics: Used for monitoring website traffic and interactions
When’s the last time you heard a board member say, “Members want…” followed by an aggregate of the last five conversations they’ve had. Data analytics helps you to uncover insights that are otherwise hard to see or understand. Let’s break down several scenarios to show how data analytics can help improve the member experience.
In an attempt to provide a seamless member experience and aggregate all member data in one place, associations have been working with technology partners to perform system integrations through single sign-on, pushing all of their transaction data back into the AMS. Best of Both Worlds. Oh, and leave those old boxes at home.
Many organizations measure the success of their products by aggregate revenue, engagement numbers, and member feedback. Understanding post-purchase behavior is an important part of the analysis. Aside from membership, do you know the most valuable products your association offers? What is the trend in sales over time?
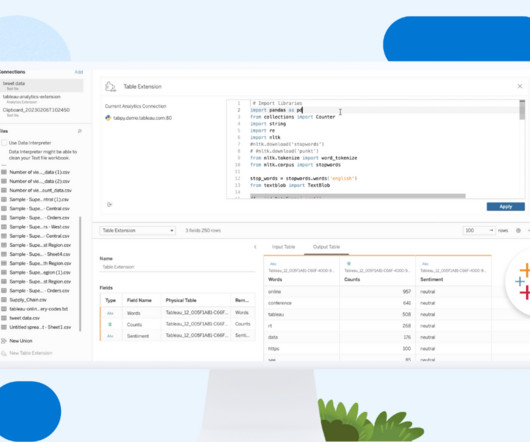
Swetha Bezawada Senior Data Scientist Colten Woo September 26, 2023 - 6:57pm October 2, 2023 The typical analytical ecosystem has two silos: business intelligence and data science. Analytics Extensions do just that! At the root, an Analytics Extension is a server that you stand up to receive data from Tableau in real-time.
One of the topics was “How to understand social networks through social network analysis and mapping techniques.&# I thought I’d expand on it here. As you can see there are many different ways to apply social networking analysis to understanding networks. Someone on your mailing list or rolodex. Family members.
Product Marketing Manager, Embedded Analytics, Tableau. As a result, analytics dashboards and visualizations are beginning to appear everywhere: in consumer apps, business software, news sites, and more. Infusing analytics into user experiences is a way we can help our customers make smarter decisions and achieve greater success.
Product Marketing Manager, Embedded Analytics, Tableau. As a result, analytics dashboards and visualizations are beginning to appear everywhere: in consumer apps, business software, news sites, and more. Infusing analytics into user experiences is a way we can help our customers make smarter decisions and achieve greater success.
Swetha Bezawada Senior Data Scientist Colten Woo September 26, 2023 - 6:57pm October 2, 2023 The typical analytical ecosystem has two silos: business intelligence and data science. Analytics Extensions do just that! At the root, an Analytics Extension is a server that you stand up to receive data from Tableau in real-time.
2009 - Connected Action - Marc Smith - Social Media Network Analysis View more presentations from Marc Smith. In our book, The Networked Nonprofit , co-authored with Allison Fine, we provide an overview of mapping your social network in Twitter and other sites using some of the social network analysis tools available. .
A recent Analytics in Action webinar, titled Embracing Data Analytics to Reinvent Your Content Marketing , delved into just this. Data Integration: Ensure your data is collected, integrated, and optimized for analysis. AI-Powered Content Creation: Use AI tools to craft personalized messages for each segment.
But the foot traffic and location analytics startup saw growth in new categories, including consumer packaged goods (CPG) and hedge funds that use its tech to perform due diligence. Placer.ai, a location data analytics startup, raises $12 million Series A. Its last funding announcement was in January 2020 for a $12 million Series A.
Digital Information World: Analysis summarizing Imperva data on bot traffic and industry breakdowns ( Digital Information World ) We’ve Been Here Before (Sort Of) Remember when mobile overtook desktop? This dual-audience analytics approach provides a complete picture of your digital presence and impact.
In reflecting over the past three years, the definition of listening tools has broadened beyond “monitoring&# or “research&# to include several categories: social media engagement management, analytics, influencer identification, and social network analysis. Saves a lot of cut and paste time and great for analysis.
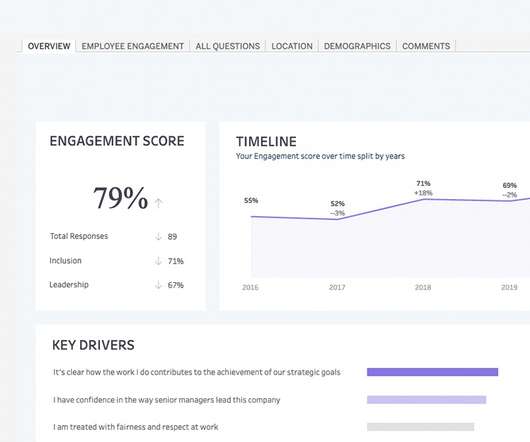
In case you aren’t familiar with a member engagement score, here’s a quick overview: it’s an analysis to assess member and customer behavior over a certain period of time (we recommend 3 years). As you look at the data in aggregate, do so for both members and non-members to get a big picture of engagement behavior.
This years list of biotech companies reflects the evolving impact of AI, a growing interest in cutting-edge research tools for single-cell analysis and spatial proteomics, and clinical advances for novel drug candidates that promise more convenient and effective treatment for conditions impacting millions of Americans.
Just as you’ve finally settled into the shift from Universal Analytics (UA) to Google Analytics 4 (GA4) and started to get a handle on its new metrics, Google has yet another deadline for organizations to meet. On July 1, 2024, Google will permanently remove access to all Universal Analytics data.
To measure the return on investment – or ROI – of your SEO campaigns, utilize the information aggregated from Positionly and Google Analytics to pull through the data and analyze patterns in traffic, increases in links, sustainable traffic and above all, increases in revenue. Rising non-branded organic traffic.
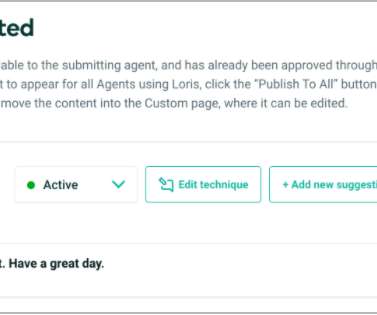
“We draw our insights from anonymized, aggregated data that have been scrubbed of personally identifiable information,” Hertz emphasized when asked about Loris’ privacy and data retention policies. Image Credits: Loris. Some research shows that customer service agents are wary of AI and automation tools.
From Enormous Data back to Big Data Say you are tasked with building an analytics application that must process around 1 billion events (1,000,000,000) a day. Figure 9–1 : Events occur at precise moments of time and can be collected and processed individually (t1->t4), or can be aggregated across windows of time (w1).
Posted by Badih Ghazi, Staff Research Scientist, and Nachiappan Valliappan, Staff Software Engineer, Google Research Recently, differential privacy (DP) has emerged as a mathematically robust notion of user privacy for data aggregation and machine learning (ML), with practical deployments including the 2022 US Census and in industry.
Generally, the rule for online surveys is to use a quantitative tool that collects “hard” data for analysis. Many of us in the member industry believe that we have entered the era of data analytics. It tends to take about 20 minutes to answer a survey of this length. But, “less is more.” If you can create a shorter tool, do it.
Participation primarily involves collecting and coding a big stack of data, which our analytics team will combine (anonymously!) In addition to helping make the study, you’ll receive an individualized analysis comparing the data you submitted for your organization to other organizations of your size and type. All-caps bold important.
Aggregated results are then pulled into a data warehouse , or semantic layer, where business users can interact with the data using business intelligence tools. . SQL access , providing SQL users with instant access to the wide breadth of data within a data lake for analysis. The evolution of data storage over time, via Databricks.
banking industry can be convinced of the utility of open banking, or if it is forced to do so via legislation, several groups are likely to benefit: Consumers will be offered novel banking and investment products based on far more detailed data analysis than exists at present. If the U.S. SMEs are underserved in a number of ways.
If we (NPOs) are investing in social media, then we should be measuring it to make sure it drives action – this presentation shows a way for just looking at Twitter using Google Analytics. o Google Analytics is free, as are many other basic analysis tools. o Just gather, analyze, and act based on key performance indicators.
Accelerator Instant access to the best analytic solutions Tableau Accelerators are ready-to-use dashboards that you can combine with your data and customize to fit your needs to help you get to data-driven insights faster. You can leverage our best practices to address 100+ use cases today. Included with Data Management.
Upgrade to take advantage of these new innovations, and learn more about how Tableau brings AI into analytics to help users across your organization answer pressing questions. Enjoy significant Azure connectivity improvements to better optimize Tableau and Azure together for analytics. Tableau 2021.1 In Tableau 2021.1, Quick LODs.
Participation primarily involves collecting and coding a big stack of data, which our analytics team will combine (anonymously!) In addition to helping make the study, you’ll receive an individualized analysis comparing the data you submitted for your organization to other organizations of your size and type. All-caps bold important.
It’s good to have basic data retrieval skills but knowing analytical functions to derive some useful insights out of your data is cherry on top of a cake and it’s fun too! Even though they are very useful for data analysis, there is some sort of confusion and people are often frighten to use them. What’s the need? Why Window Function?
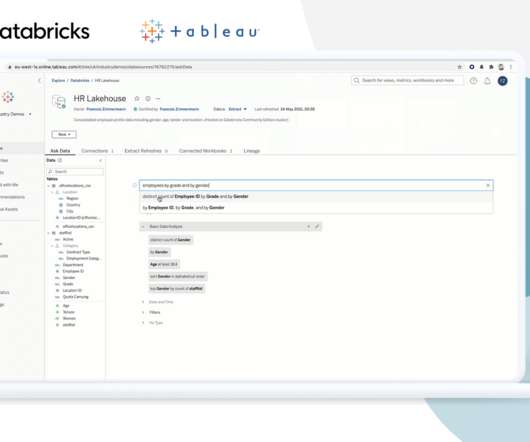
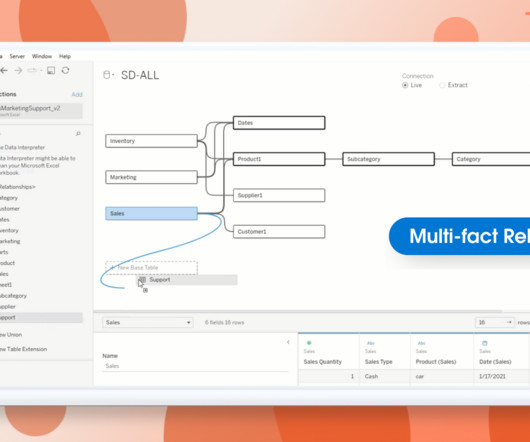
Spencer Czapiewski July 25, 2024 - 5:54pm Thomas Nhan Director, Product Management, Tableau Lari McEdward Technical Writer, Tableau Expand your data modeling and analysis with Multi-fact Relationships, available with Tableau 2024.2. This is complementary to inner-joining dimensions for tables that are directly related.
What is Training Needs Analysis and how to perform it? GyrusAim LMS GyrusAim LMS - Training Needs Analysis is an inevitable part of all the organizations that want to improve their employees’ skill sets and believe in the cumulative growth of the company. This analysis helps them to do their job more effectively.
What is Training Needs Analysis and how to perform it? GyrusAim LMS GyrusAim LMS - Training Needs Analysis is an inevitable part of all the organizations that want to improve their employees’ skill sets and believe in the cumulative growth of the company. This analysis helps them to do their job more effectively.
What is Training Needs Analysis and how to perform it? Gyrus Systems Gyrus Systems - Best Online Learning Management Systems Training Needs Analysis is an inevitable part of all the organizations that want to improve their employees’ skill sets and believe in the cumulative growth of the company.
Thankfully, Google Analytics makes it easy. You’ve likely heard that Google has released its new version, Google Analytics 4 (GA4). What Is Google Analytics 4? But what Google Analytics — and GA4 in particular — brings to the table is an extra layer of information. For Google Analytics, that would be a UTM parameter.
” Rocketbrew: A competitive analytics dashboard for e-commerce brands, giving you an easy view of “how competitors price, launch new products and manage their product portfolio.” RED Atlas: A platform for real estate insights and analytics, focusing first on Puerto Rico.
Additionally, we would like to have analysis on the day and mothly basis because we need aggregated sums on different granularity. I will go over the raw data to load the day, go over the daily aggregated data to load the month, and finally through the daily data to update the counts for the user that have changed.
And how to ingest valuable data for free Photo by Tobias Fischer on Unsplash Data modeling can be a challenging task for analytics teams. Below are 3 generic tables that can streamline your team’s analytics, which you can ingest into your Data Warehouse in the context of a dimensional model. ?️The But fear not!
I have been knee deep researching and thinking about Web Analytics in general and Google Analytics in particular for a third screencast in a series I'm doing for NTEN. The research has been going slowly -- partly because web analytics is a very complex and geeky topic. Analytics This! Zen and the Art of Web Analytics.
Industry Data Analysis Many associations aggregate data and then provide it back to members. Sign Up: Using Your Data to Move Away From One-Size-Fits-All Renewal Campaigns The post Thinking Outside the Traditional Non-Dues Revenue Box appeared first on Association Analytics.
Fitbit activity analysis with DuckDB Photo by Jake Hills on Unsplash Wearable fitness trackers have become an integral part of our lives, collecting and tracking data about our daily activities, sleep patterns, location, heart rate, and much more. I’ve been using a Fitbit device for 6 years to monitor my health. Why DuckDB?
There are two solutions for integrating your data — either build an in-house centralized data platform or research an analytics vendor to outsource data collection and analysis. Use analytics tools to surface new patient insights. So, how do healthcare organizations overcome these data silos? Informed fundraising plans.
The sector deserves comprehensive and computable data that can be openly aggregated, searched, checked, and analyzed. And it need not threaten their revenue models: What they lose on the sale of bulk data, they can more than make up for by providing new tools and analytic services.
2020 Web Tech Approach To Social Media Analytics View more presentations from Gaurav Mishra. 20:20 Social Media Analytics Blog; A colleague just shared a link to this blog by Guarav Mishra's company. 2020 Web Tech Approach To Social Media Analytics View more presentations from Gaurav Mishra. Here's the slide.
Seamless Data Analytics Workflow: From Dockerized JupyterLab and MinIO to Insights with Spark SQL Once everything’s ready, we’ll start by preparing our sample data. It shines in analytical scenarios, particularly when you’re sifting through data column by column. Next up, we’ll run an aggregation query on our Parquet data.
We organize all of the trending information in your field so you don't have to. Join 12,000+ users and stay up to date on the latest articles your peers are reading.
You know about us, now we want to get to know you!
Let's personalize your content
Let's get even more personalized
We recognize your account from another site in our network, please click 'Send Email' below to continue with verifying your account and setting a password.


Let's personalize your content