This site uses cookies to improve your experience. To help us insure we adhere to various privacy regulations, please select your country/region of residence. If you do not select a country, we will assume you are from the United States. Select your Cookie Settings or view our Privacy Policy and Terms of Use.
Cookie Settings
Cookies and similar technologies are used on this website for proper function of the website, for tracking performance analytics and for marketing purposes. We and some of our third-party providers may use cookie data for various purposes. Please review the cookie settings below and choose your preference.
Used for the proper function of the website
Used for monitoring website traffic and interactions
Cookie Settings
Cookies and similar technologies are used on this website for proper function of the website, for tracking performance analytics and for marketing purposes. We and some of our third-party providers may use cookie data for various purposes. Please review the cookie settings below and choose your preference.
Strictly Necessary: Used for the proper function of the website
Performance/Analytics: Used for monitoring website traffic and interactions
We are delighted to be able to share the 2025 M+R BenchmarksStudy with you. Download the full pdf now , or visit mrbenchmarks.com for key findings and literally 115 charts about digital fundraising, marketing, advocacy, and more. About half of M+R Benchmarks participants reported working with social media influencers in 2024.
Published today, M+R and NTEN’s 2014 Nonprofit BenchmarksStudy returns for the eighth year. We''ve crunched the numbers from 53 nonprofit organizations to define this year''s industry standards for online fundraising, advocacy, and list building. Monthly website traffic for the nonprofits in the study was up 16% in 2013.
The annual M+R BenchmarksStudy is a tasty fusion of digital fundraising, advocacy, and marketing data. We hope you’ll join us and participate in our upcoming 2023 M+R Benchmarks. Again, we take measures to make sure that your organization’s data is confidential and non-identifiable in the final study.
The maître d’ has called your name, the table is set, and the napkins are folded up like fancy little swans: it’s time to dig in to a year’s worth of M+R Benchmarks charts, findings, and insights at mrbenchmarks.com ! The 2023 M+R BenchmarksStudy is served! Sign up for the webinar now. The post Come and get it!
Which is why we’re excited to invite organizations to participate in M+R and NTEN’s 2015 BenchmarksStudy to help determine this year’s industry standards for online fundraising, advocacy, and list building. Still not clear on what Benchmarks is or why you will love being a part of it? We thought so. Not a problem.
Part of the M+R Infographic for BenchmarkStudy. You can do a “quick and dirty” benchmarkstudy by looking at one or two similar organizations. But it is really nice to have some industry wide numbers. How does your organization identify benchmarks as part of its measurement process?
The much-anticipated 2013 eNonprofit Benchmarkstudy was released last week. It contains online fundraising, advocacy, email, social, and mobile results from 55 U.S.-based Nonprofits often use this study to benchmark their own online activities and fundraising ideas. based national nonprofits in 2012.
Here it comes, hot off the presses: The 2021 M+R BenchmarksStudy will go live on Wednesday, April 21. It’s all the newest news and topical trends affecting nonprofit digital marketing, advocacy, and fundraising. . 2021 Benchmarks UK FAQ. Everything you need to know about participating in the 2021 Benchmarks.
Check out the 2010 eNonprofit BenchmarksStudy from M+R Strategic Services and NTEN which surveyed 40 nonprofit organizations and analyzed all of this data and more. Key Benchmarks: How Did Your Nonprofit Measure Up ? Online Advocacy and Email. The 2010 advocacy response rate was 3.3%. Online Fundraising.
The annual M+R BenchmarksStudy is a wide-ranging exploration of digital fundraising, advocacy, and marketing data. We’d like to invite you to come along by participating in our upcoming 2022 M+R Benchmarks. . The window to sign up as a Benchmarks participant is open NOW. Related Links: Benchmarks UK is here!
The 2012 eNonprofit BenchmarksStudy was just released and is packed with insightful data on advocacy and fundraising response rates across the nonprofit sector. In particular we were excited to see advocacy response rates increased 28% between 2010 and 2011. Overall, email open rates held steady between 2010 and 2011.
Advocacy Online and Fairsay are jointly producing a benchmark report to examine key e-campaigning performance measures. The benchmark data is derived from the activity of over 2 million supporters from 50 campaigning organisations in the UK, Canada, and several other countries. If you are in London, you can join me!
Hoping to hop on the 2022 Benchmarks train? This Friday (December 3) is the last day to sign up to be part of the next Benchmarks journey ! And please reach out to benchmarks@mrss.com with any questions. The annual M+R BenchmarksStudy is a wide-ranging exploration of digital fundraising, advocacy, and marketing data.
I’ll try to keep it short and just sweet enough to fill you in on everything you need to know about the new 2010 eNonprofit BenchmarksStudy from M+R Strategic Services and NTEN. When we started analyzing the results of this year’s study, the nonprofit world was still licking its wounds from 2009.
There’s no wrong way to dig into our annual BenchmarksStudy, covering digital programs from marketing to fundraising to advocacy. Others prefer a sense of community and the chance to ask questions, and a few hundred of them joined us for a Benchmarks webinar yesterday. . Read time: 2 minutes. Check it out.
Last month we reported that online fundraising response rates declined 27% between 2011-2012, according to the eNonprofit Benchmarkstudy. Online Revenue and Advocacy Growth. Advocacy saw an 8.7% This is down slightly from the previous study where email registrations were 2.24%. Nonprofit BenchmarkStudies'
The new 2010 eNonprofit BenchmarksStudy from NTEN and M+R was just released today! The new report might look slim and slick, but this scrappy guide is thick with valuable insights and key industry benchmarks for online messaging, fundraising and advocacy, based on a full year's worth of results from 31 of your nonprofit peers. >
One important part of effective digital measurement is being able to benchmark your performance relative to your organization’s past performance or compared to peer organizations. One excellent resource to use for benchmarking nonprofit digital results (in the US) is the annual M&R Benchmarksstudy of nonprofit digital advocacy.
March is not only great for basketball, but is also good for nonprofit research studies about digital strategies and launches of new data tools. So if you like looking at and thinking about data and love to get your hands dirty with a data jujitsu, here’s a couple of goodies for you. RESEARCH STUDIES. … Read More
The latest edition of the annual M+R BenchmarksStudy has arrived, and here’s your ticket to ride. This year, 225 wonderful nonprofits partners joined in the fun, contributing data on fundraising, advocacy, engagement, mobilization, and marketing. UK and Ireland friends: your study is coming soon! Sign up now!
You can now download the 2012 eNonprofit BenchmarksStudy , just released at the 2012 NTC by M+R and NTEN. New this year and particularly interesting to me is what we learned from the study participants with mobile programs: roughly a third had optimized their emails for display on smart phones. a third had not. a third had not.
Another NTC means more great studies about nonprofit technology released, including the 2012 " Nonprofit Social Networking Benchmarks Report." for yourself: > Download the 2012 Nonprofit Social Network Benchmark Report. It's free! >
The deadline to join the 2023 BenchmarksStudy is THIS Friday, December 2. The annual M+R BenchmarksStudy is a tasty fusion of digital fundraising, advocacy, and marketing data. We hope you’ll join us and participate in our upcoming 2023 M+R Benchmarks. Join us for Benchmarks 2023 first appeared on M+R.
NTEN partnered with Charity Dynamics to conduct the 2012 Nonrprofit Donor Engagement Study. This donor-focused study gathered feedback from consumers spanning a wide range of giving levels ($25 – $5,000+) who donated to a nonprofit in the past 12 months. > Download the study online here.
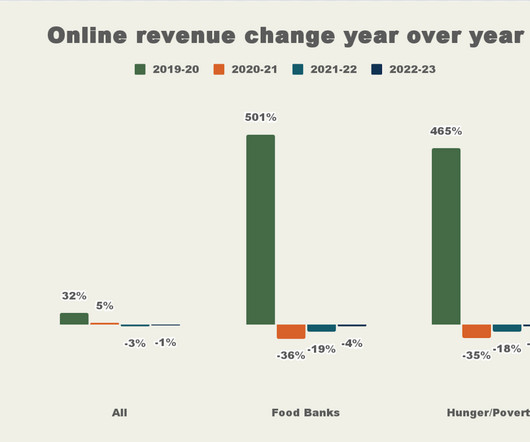
This year, a record 27 regional food banks participated in M+R’s annual BenchmarksStudy covering mostly digital fundraising, marketing, advertising, and advocacy metrics (and here’s another plug…if you haven’t dug into this year’s study, do it now!). Here are a few of the toplines and takeaways we see.
After studying over 50 international nonprofit organization's email lists and response rates, the 2009 eCampaigning Review Study revealed that 60% of nonprofits present a compelling argument for supporters to take action, yet close to 70% of the organizations did not send a follow up email within one month. Nonprofits need to: 1.
We just released the 2009 eNonprofit BenchmarksStudy with our fantastic friends at M+R Strategic Services. Get the recording to see how Children's Defense Fund and HRC use benchmarks to increase the performance of their online campaigns. We have a case study of a mobile/email campaign integration that yielded great results.
It's kind of our favorite time of year: our annual dose of data about email and online advocacy and fundraising activity. With the analytics and campaign expertise of M+R Strategic Services , we are excited to release the 2013 eNonprofit BenchmarksStudy ! So: What’s going on with nonprofit email, fundraising, and social media?
The 2011 eNonprofit BenchmarksStudy is a joint project of M+R Strategic Services and the Nonprofit Technology Network (NTEN). The 2011 eNonprofit BenchmarksStudy (available at www.e-benchmarksstudy.com The 2011 Benchmarks average unsubscribe rate is 0.23%. benchmarksstudy.com if you haven’t read it yet!)
That’s a good number, but that leaves 53% of nonprofits worldwide that haven’t yet come to the understanding that Facebook can be a colossal waste of time if you are not following these best practices and at least occasionally purchasing Facebook Ads for special fundraising and advocacy campaigns.
I shared results from the newest eNonprofit BenchmarksStudy from NTEN and M+R Strategic Services. The fundraising response rate fell by 19%, while the advocacy response rate fell by 7%. Advocacy actions and items of personal interest tend to result in more click-throughs from newsletters. Highlights.
Are people who like or comment on these videos signing up for organization’s enewsletters, are they donating money, volunteering, taking an advocacy action? These are the types of questions we hope to see answered in the upcoming video benchmarkstudy for nonprofits being conducted by Edelman, See3 Communications, and YouTube.
All Blackbaud Blogs Contact Us Blackbaud.com About Nonprofit Trends Books Research Reports Speaking Video: Online Advocacy Trends Posted by Steve MacLaughlin on April 6th, 2011 The recordings from Blackbaud and Care2′s Advocacy Live 2011 event are now online.
The 2012 eNonprofit Behnchmarks Study was just released and it''s packed with all sorts of juicy email, advocacy, and fundraising data from 55 nonprofits ranging from environmental organizations to human rights organizations. Nonprofit BenchmarkStudies Online Advocacy Online Fundraising Trends' Online Fundraising.
Prepare for takeoff: The 2022 M+R BenchmarksStudy lands on Wednesday, April 27. Visit mrbenchmarks.com on April 27 to get the lay of the fundraising, advocacy, and digital marketing land. Read time: 1 minute. Sign up for the webinar now. .
Downtime may be hard to come by with SXSWi , NTC and AFP International activity this week, but just in case you have a few minutes to burn waiting for a flight, train or a panel to start, I’m arming you with some exhilarating reading material — the Convio Online Marketing Nonprofit Benchmark Index Study. percent in 2009.
The accepted best practice is to post to Instagram once to three times daily, but for most nonprofits posting more than once daily is a ridiculous benchmark. To reach the 10,000 follower benchmark, send an email to your list asking your supporters to follow you on Instagram or purchase advertising to secure more followers.
Prepare for takeoff: The 2022 M+R BenchmarksStudy lands on Wednesday, April 27. Visit mrbenchmarks.com on April 27 to get the lay of the fundraising, advocacy, and digital marketing land. Read time: 1 minute. Sign up for the webinar now. .
Last summer, we pulled together data from some of the country’s leading nonprofits to bring you the 2011 Benchmarks Extra: Facebook report, laying out basic benchmarks for nonprofit pages on Facebook. To download the 2012 Benchmarks Extra: Facebook, simply “like” M+R's page on Facebook.
P.S. Guess who will be releasing a Benchmarksstudy on April 24? The annual M+R BenchmarksStudy will once again explore the labyrinth of nonprofit digital fundraising, advocacy, and marketing metrics. Hope to talk with you soon! See you in the co-op! The post Scout Quest Webinar Recap: Humane Society Results!
A few days ago, I reported some of the juicy details from the 2013 eNonprofit BenchmarksStudy that was just released showing data from 2012. There were 55 of the country’s leading nonprofits surveyed for this study, including the American Red Cross, Oceana, American Heart Association, AARP , and Human Rights Watch.
2011 eNonprofit BenchmarksStudy A visual version of the 2011 eNonprofit BenchmarksStudy by M+R Strategic Services and NTEN. Based on 2006 data, the chart features the 10 major sources of revenue for U.S. Get the latest data on email open rates, social media usage, email churn, and more.
Tweets can be 280 characters, but studies have shown that tweets between 71 and 100 characters perform better than longer tweets. WebFX is an excellent resource for social media advertising benchmarks and their research reveals that Twitter has the lowest cost-per-click (CPC) of all social media.
A few weeks ago, I wrote a blog post on how organizations can use Convio’s Online Nonprofit BenchmarksStudy to determine how well they are doing online compared to others. The findings mirror many of benchmarks in the Convio report. percent and email advocacy rates at 4 percent. donating money).
We organize all of the trending information in your field so you don't have to. Join 12,000+ users and stay up to date on the latest articles your peers are reading.
You know about us, now we want to get to know you!
Let's personalize your content
Let's get even more personalized
We recognize your account from another site in our network, please click 'Send Email' below to continue with verifying your account and setting a password.


Let's personalize your content