Remove Advocacy Remove Benchmark Remove Metrics Remove Newsletter
article thumbnail

Social Media with M+R: How to Measure the Metrics that Matter

EveryAction

Last week, I sat down with Amy Peyrot, Senior Consultant, Social Media Specialist, and resident mathlete at M+R , to discuss all things social media metrics. Once you know what qualifies as success, Amy suggests setting your goals based on benchmarks you've established for your organization, although this is a good place to start.

Metrics 100
article thumbnail

2012 eNonprofit Benchmarks Study Highlights Online Advocacy, Fundraising, and Social Media Metrics

Care2

The 2012 eNonprofit Benchmarks Study was just released and is packed with insightful data on advocacy and fundraising response rates across the nonprofit sector. In particular we were excited to see advocacy response rates increased 28% between 2010 and 2011. Enewsletters: Newsletter received on average a 13% open rate, a 1.6%

professionals

Sign Up for our Newsletter

This site is protected by reCAPTCHA and the Google Privacy Policy and Terms of Service apply.

article thumbnail

10 Twitter Best Practices for Nonprofits

Nonprofit Tech for Good

Please sign up for Nonprofit Tech for Good’s email newsletter to be alerted of new posts. For example, @nonprofitorgs/lists : Customized for small nonprofits on a limited budget, the Social Media Best Practices for Nonprofits webinar highlights current trends in using social media for fundraising, advocacy, and storytelling.

Twitter 336
article thumbnail

eNonprofit Benchmarks Study Reveals Latest Metrics for Advocacy, Fundraising and Social Media

Care2

Check out the 2010 eNonprofit Benchmarks Study from M+R Strategic Services and NTEN which surveyed 40 nonprofit organizations and analyzed all of this data and more. Key Benchmarks: How Did Your Nonprofit Measure Up ? Online Advocacy and Email. The 2010 advocacy response rate was 3.3%. Online Fundraising.

article thumbnail

6 Ways to Raise More with Facebook Fundraisers

Nonprofit Tech for Good

By Brent Merritt , a digital strategy consultant at Metric Communications and blogger at The Caliper. His work is focused on nonprofits, advocacy, and public affairs. About the Author: Brent Merritt is a digital strategy consultant at Metric Communications and blogger at The Caliper.

Facebook 217
article thumbnail

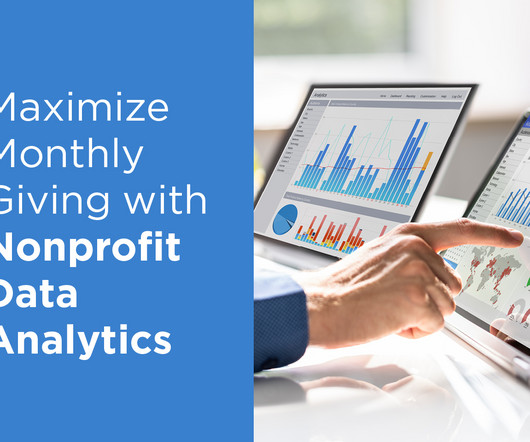
Maximize Monthly Giving with Nonprofit Data Analytics

Pamela Grow

According to the latest M+R Benchmarks Study , monthly giving increased by 11% in 2022, making up 28% of all online revenue. Before you begin any project involving data analysis, start by clearly outlining your goal so you know which metrics to analyze. Understand donors’ giving behaviors. Monitor data and adjust your appeals.

article thumbnail

Making More of Your Metrics

NTEN

Since the release of the 2010 eNonprofit Benchmarks Study , we know many of you have been hard at work looking at how your programs measure up against industry benchmarks. But the Benchmarks Study is really meant to help you think (or rethink!) Source Everything ! Let's say you want to track your email fundraising open rate.

Metrics 55