This site uses cookies to improve your experience. To help us insure we adhere to various privacy regulations, please select your country/region of residence. If you do not select a country, we will assume you are from the United States. Select your Cookie Settings or view our Privacy Policy and Terms of Use.
Cookie Settings
Cookies and similar technologies are used on this website for proper function of the website, for tracking performance analytics and for marketing purposes. We and some of our third-party providers may use cookie data for various purposes. Please review the cookie settings below and choose your preference.
Used for the proper function of the website
Used for monitoring website traffic and interactions
Cookie Settings
Cookies and similar technologies are used on this website for proper function of the website, for tracking performance analytics and for marketing purposes. We and some of our third-party providers may use cookie data for various purposes. Please review the cookie settings below and choose your preference.
Strictly Necessary: Used for the proper function of the website
Performance/Analytics: Used for monitoring website traffic and interactions
For Nonprofits in the United States: 1) 2012 State of the Nonprofit Industry Report :: Download. 2) 2012 eNonprofit Benchmarks Study :: Download. 3) Giving USA 2012: Annual Report on Philanthropy for the Year 2011 :: Download. 4) 2012 Nonprofit Social Network Benchmark Report :: Download. Published by NTEN.
6) Giving USA 2012: Annual Report on Philanthropy for the Year 2011 :: Download. 7) 2012 mGive Text Giving Study :: Download. 8) 2012 Effect of the Economy on the Nonprofit Sector Report :: Download. 9) 2012 Millennial Impact Report :: Download. 10) 2012 State of the Nonprofit Industry Report :: Download.
For Nonprofits in the United States: 1) 2012 eNonprofit Benchmarks Study :: Download. 2) Giving USA 2012: Annual Report on Philanthropy for the Year 2011 :: Download. 3) 2012 Nonprofit Social Networking Benchmark Report :: Download. 3) 2012 Nonprofit Social Networking Benchmark Report :: Download.
8) Giving USA 2012: Annual Report on Philanthropy for the Year 2011 :: Download. 9) 2012 mGive Text Giving Study :: Download. 10) 2012 Effect of the Economy on the Nonprofit Sector Report :: Download. 11) 2012 Millennial Impact Report :: Download. Published by See3 Communications. Published by mGive.
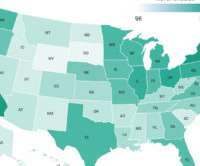
1) The Silent Generation (1925-1945) 88% give to charity, donating an annual average of $1,367 across 6.2 1) The Silent Generation (1925-1945) 88% give to charity, donating an annual average of $1,367 across 6.2 organizations** 11.8% organizations** 11.8% They are known for their loyalty to the causes they support.
In the coming years, trillions of dollars in wealth held by the Baby Boomer generation (born from 1955– 1964) are poised to transfer to their children and grandchildren, millennials (1981 – 1996) and Generation Z (1997 –2012). This offers a glimpse into the significant role their charitable priorities will play in the future of philanthropy.
The intent is to create an annual national day of giving on the Tuesday after Thanksgiving or this year on November 27, 2012. The campaign will encourage philanthropic activities that support nonprofit organizations.
Applications for all Heroes with a Heart grant awards open on Wednesday, February 1st, 2012 and close Wednesday, February 29th, 2012 at midnight. Finalists will appear on the CTK Facebook page for public voting during April and winners will be announced on May 1, 2012.
MCON 2012, a virtual summit to help nonprofit leaders learn how to engage the Millennial generation as donors, takes place online on July 19. The Chronicle on Philanthropy announced the findings this morning online in two separate articles here and here. The description.
In this case, it's a recap of some of the big nonprofit technology stories of 2012. Top Nonprofit Technology Buzzwords of 2012. "Hackathon" was, in fact, one of Lucy Bernholz' top 10 philanthropy buzz words for 2012. By the way, Lucy Bernholz' top buzz word of 2012 was " data."
I’ve been a huge fan of GivingTuesday since I first heard about it back in September, 2012 during a conference at Stanford. GivingTuesday is done it again with its K-12 Philanthropy Curriculum , a set of lesson plans that teachers can use to help their students participate in GivingTuesday by raising money for a local nonprofit.
Published by the Charities Aid Foundation. 2012 State of Social Media Use in Australian Nonprofits :: Download. 2013 Social Charity Index :: Download. Published by Philanthropy Age. For Nonprofits Worldwide: 1. 2016 Global NGO Online Technology Report :: Download. 2015 World Giving Index :: Download.
Since 2012, thousands of nonprofits have run campaigns on CauseVox ’s fundraising platform. That’s why you should try incorporating more events into your charity’s annual fundraising plan. That’s why you should try incorporating more events into your charity’s annual fundraising plan. Click to Tweet. Polar Plunge. 5K/Marathon.
Each radio program/live call allows 5,000 listeners and topics range from social media to philanthropy. Each month, DollarPerMonth.org selects three charities for its members (who have pledged to donate a minimum of $1 per month) to vote on. It also has a “Charities and NGOs” section. Formstack :: formstack.com.
Rob Reich, Professor of Political Science, Stanford University Center for Ethics in Society, Center on Philanthropy & Civil Society, has just released a new book called “ Just Giving: Why Philanthropy is Failing Democracy and How It Can Do Better.” In 2017, $410 billion was given in philanthropy.
Each month, DollarPerMonth.org selects three charities for its members (who have pledged to donate a minimum of $1 per month) to vote on. The winning charity receives 50% of the community donations, the 2nd charity receives 30%, and the 3rd charity receives 20%. It also has a “Charities and NGOs” section.
The latest Chronicle of Philanthropy survey of American corporate giving essentially finds that companies are still giving out cash grants, but are putting more energy into product or in-kind philanthropy. The Chronicle of Philanthropy has been surveying large American companies on their philanthropy annually since 2005.
Named one of TIME’s 50 Best Websites of 2012 , Outlook.com is Microsoft’s new Web-based email service. JustCoz.org is a platform that enables charities, nonprofits, and NGOs to increase their social media reach by way of tweet and status update donations. Outlook.com :: outlook.com. npCloud :: npcloud.org.
You may recall that the NTEN community recently helped us raise over $15,000 to host more local events throughout 2012. Donating products to charities helps corporate bottom lines, reduces waste in landfills, and provides relief for people in need. One of the things we wished for as we navigated the campaign: benchmarks.
Each radio program/live call allows 5,000 listeners and topics range from social media to philanthropy. It also has a “Charities and NGOs” section. If your nonprofit is on Google+, be sure to add your Page to the “ Nonprofit ” and “ Charity ” groups. CheckFacebook :: checkfacebook.com.
Join in on The World's Fare and host a dinner for six or more friends at 7pm local time on October 5, 2012 (last day of the Conference). " The Internet has become a spontaneous, grassroots fundraising tool – Small Act – "Philanthropy has turned on its ear. It’s a tricky task, but someone has to do it!"
The study also shows how much charities are still struggling to raise money in a bad economy. At this rate, philanthropic giving would not recover until 2022, said Patrick Rooney, Executive Director of the Indiana University Center on Philanthropy, which coordinates the Giving USA study. Tips to Raise More Money in 2012.
As summer starts, we’ll report on what happened to Facebook Causes, some big developments in cloud computing including the launch of Salesforce1, a big partnership between Salesforce and Microsoft that bodes well for charities, and the launch of Box.org, free cloud storage for nonprofits. It was one of the original 10 Facebook apps.
75% of Young Adults Gave to Charity Last Year, Study Finds – News – The Chronicle of Philanthropy- Connecting the nonprofit world with news, jobs, and ideas – The new Millennial Donor Survey is out! "Charities What do you think? Would love to hear your thoughts.
According to a new study by the Indiana University Lilly Family School of Philanthropy and Jumpstart Labs , nearly three-quarters of U.S. is to secular, or non-religious charities. In 2012, 63 percent of all Americans contributed to charities of all types. tsreligiousorgs Faith-based charities religious organizations'
A report released by The Center for Effective Philanthropy suggested that over 70 percent of surveyed nonprofits said that their funders do not tend to provide any support for assessment efforts. For many years, nonprofit watchdogs such as Charity Navigator have rated nonprofit organizations based on financial accountability and transparency.
The latest Chronicle of Philanthropy survey of American corporate giving essentially finds that companies are still giving out cash grants, but are putting more energy into product or in-kind philanthropy. The Chronicle of Philanthropy has been surveying large American companies on their philanthropy annually since 2005.
Then in 2012, Ross Hendrickson and myself decided to start Bloomerang based upon the premise of bringing proven best practices in professional fundraising to life. Prior to Bloomerang, he was the CEO and Co-Founder of eTapestry for 11 years, which at the time was the leading SaaS technology company serving the charity sector.
Unions, charity and voluntarism. While this blog is largely focused on new developments in unions’ engagement with philanthropy, it is important to acknowledge that unions have long encouraged their members to be engaged in the community. Trends in unions’ engagement with philanthropy. Labor Unions and Charity."
This level of increased global philanthropy is worth a further look. The Hudson Institute’s Center for Global Prosperity recently published its Annual Index of Global Philanthropy and Remittances for 2010 and reported “financial flows to the developing world from the United States increased notably in 2010 to $326.4 PHILANTHROPY (U.S.
She has worked in healthcare, politics and government, and technology for more than 20 years and appreciates working with nonprofit fundraisers and philanthropy consultants who use NOZA philanthropy data every day. Now, it’s the nearing the end of 2012. How much should I ask for? How can my board members help?
GEO’s 2012 National Conference shared a range of perspectives and new ideas for smarter grantmaking that leads to better results and presents opportunities for participants to learn from the wisdom and experience of their peers. The Internet Gets Charitable – guest post by Darin McKeever. that touches on the subject.
Online Giving Grows as Charities Polish Their Methods : According to the Chronicle of Philanthropy, online giving is growing at a blistering pace. billion, just between 2011 and 2012; and that online contributions to the largest 149 charities in the US also grew 14 percent, to $785-million.'
The election of 2012 will prove to be a momentous event in our nation’s history. A new report from the Brennan Center, Voting Law Changes in 2012 , paints a rather ugly portrait of the rapid decline of American democracy. The Networked Nonprofit Response to the Concerted Attack on Voting Rights , Guest Post by Vince Stehle.
This month he explores why and how networked nonprofits should rally for more transparency in campaign funding based on a more detailed article over at the Chronicle of Philanthropy. The first thing any charity can do is to exercise its own rights to engage in nonpartisan electoral education activities.
The idea is for charities and the people who support them to sign up on the #GivingTuesday website. Supporters commit to doing something good like donating money or services to a registered charity. Charities agree to spread the word about the movement to their networks and to submit. There is no cost of course.
2002-2012 – Childhood During the first 10 years, Candid staff primarily focused on collecting grants of $10,000 or more awarded by a sample of the largest U.S. funders, and public foundations (aka grantmaking public charities). private and community foundations. Which is why we are releasing our new research manual.
Thankfully, a recent survey conducted by BoardSource in 2012 shows signs of increased governance among nonprofits 2. Nonprofit Governance Index 2012: CEO Survey of BoardSource Members. 3 October 2012. The Central Asia Institute is only one nonprofit organization that has fallen from grace due to poor nonprofit governance.
Small charities that get the most votes from their online supporters are eligible to win up to $250,000, and a total of $5-million will be awarded through the competition.
While both are important to your nonprofit, charity, cause, or library, both together just might be its secret weapon. He runs the design blog Redesigning Good on the Chronicle of Philanthropy, and has written for publications such as the Stanford Social Innovation Review and.net magazine. He served as a mentor at SXSWi in 2012.
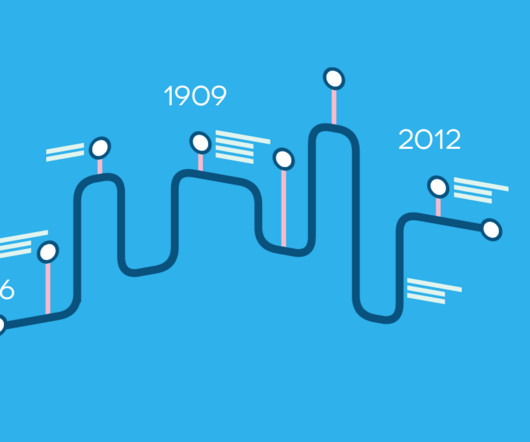
Were donations to charities always tax-deductible? Check out these pivotal moments in the history of nonprofits, foundations, and philanthropy throughout American history: The Union Fire Company in Philadelphia , founded by Benjamin Franklin in 1736, was the first volunteer-based organization in U.S. focused on fighting fires.
Takes Online Sales Mobile With App Update - Philanthropy Today - The Chronicle of Philanthropy- Connecting the nonprofit world with news, jobs, and ideas : Goodwill D.C. Takes Online Sales Mobile With App Update April 16, 2012, 10:27 am The Washington, D.C.-area Goodwill D.C.
Yesterday was the fourth Giving Tuesday , a global day of community-driven philanthropy. If you tweeted with the hashtag #IGiveBecause – you received a $20 gift card to donate to the charity of your choice on their site. Today is ThankYouWednesday because it was a huge success, including financial with 52% increase in giving.
We organize all of the trending information in your field so you don't have to. Join 12,000+ users and stay up to date on the latest articles your peers are reading.
You know about us, now we want to get to know you!
Let's personalize your content
Let's get even more personalized
We recognize your account from another site in our network, please click 'Send Email' below to continue with verifying your account and setting a password.


Let's personalize your content