2012 Year-End Fundraising Email Analysis
NetWits
JANUARY 31, 2013
Despite the trend that additional emails have helped increase the total number of transactions without compromising open rates, the 2012 results told a slightly different story.
This site uses cookies to improve your experience. To help us insure we adhere to various privacy regulations, please select your country/region of residence. If you do not select a country, we will assume you are from the United States. Select your Cookie Settings or view our Privacy Policy and Terms of Use.
Cookies and similar technologies are used on this website for proper function of the website, for tracking performance analytics and for marketing purposes. We and some of our third-party providers may use cookie data for various purposes. Please review the cookie settings below and choose your preference.
Used for the proper function of the website
Used for monitoring website traffic and interactions
Cookies and similar technologies are used on this website for proper function of the website, for tracking performance analytics and for marketing purposes. We and some of our third-party providers may use cookie data for various purposes. Please review the cookie settings below and choose your preference.

NetWits
JANUARY 31, 2013
Despite the trend that additional emails have helped increase the total number of transactions without compromising open rates, the 2012 results told a slightly different story.

NetWits
APRIL 5, 2013
based national nonprofits in 2012. One of the eye-catching findings from the study was the steep decline in the performance of fundraising emails in 2012. This follows a recent trend that email click-through rates have declined across all industries. percent to 4.5 percent over the past year. What’s to blame?
This site is protected by reCAPTCHA and the Google Privacy Policy and Terms of Service apply.

Amy Sample Ward
FEBRUARY 20, 2012
" Check out the 12 Trends, from Personalized Video Thanking to Ebooks to Digital Fundraising Staffing! " Check out the 12 Trends, from Personalized Video Thanking to Ebooks to Digital Fundraising Staffing! When these organizations are included in the analysis the overall online fundraising growth rate drops to 0.3%."

sgEngage
AUGUST 7, 2012
The Blackbaud Index of Charitable Giving and The Blackbaud Index of Online Giving provide fundraisers with up-to-date data on fundraising trends and to couple that information with valuable analysis by leaders in the sector. Overall Fundraising Trends. for the 3 months ending June 2012 as compared to the same period in 2011.

sgEngage
SEPTEMBER 6, 2012
The Blackbaud Index of Charitable Giving and The Blackbaud Index of Online Giving provide fundraisers with up-to-date data on fundraising trends and to couple that information with valuable analysis by leaders in the sector. Overall Fundraising Trends. for the 3 months ending July 2012 as compared to the same period in 2011.

sgEngage
JULY 5, 2012
The Blackbaud Index of Charitable Giving and The Blackbaud Index of Online Giving provide fundraisers with up-to-date data on fundraising trends and to couple that information with valuable analysis by leaders in the sector. Overall Fundraising Trends. for the 3 months ending May 2012 as compared to the same period in 2011.
Whole Whale
NOVEMBER 7, 2021
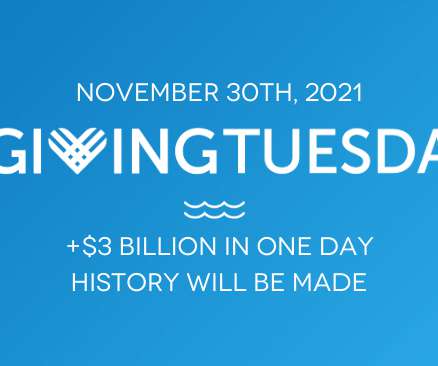
Based on our analysis that incorporates an adjusted linear regression, trends in Google Search terms around “Giving Tuesday,” and national giving trends, we predict that $3.048 Billion will be raised on Giving Tuesday 202 1. since 2012. Giving Tuesday 2012 stats. of the 2012 GDP ($15,553.8
Candid
SEPTEMBER 13, 2021
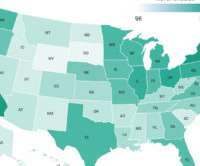
labor unions based on Candid’s data and discuss trends and opportunities for future research. Trends in unions’ engagement with philanthropy. This strategy, known as “bargaining for the common good,” was a central part of the Chicago Teachers Union’s (CTU) approach during their 2012 strike. Unions by the numbers.

NetWits
APRIL 2, 2013
The industry report identifies the trends (see the Blackbaud Index ) which are used to inform the health of your online program, not overall constituent engagement. The benchmark trends are important because they help us ensure our approach is on the path toward success, but a more accurate measurement is the number of constituents engaged.

NTEN
NOVEMBER 1, 2012
> Download the 2012 NTEN Community Survey Report. In May of 2012 we circulated the link to the online survey to the NTEN Community via direct email (sent to 38,354 contacts) and announcements in our community channels, including our blog, NTEN Discuss email list, our Facebook page, and our Twitter network.

Beth's Blog: How Nonprofits Can Use Social Media
SEPTEMBER 6, 2012
Mission Measurement (@MissionMeasure) September 5, 2012. The September, 2012 Issue of the NTEN Change Journal is pure crack for nonprofit #datanerds (folks who would definitely wear a t-shirt emblazoned with “I Love Data!” We may need to start wearing these here! ” in the office). .”

sgEngage
MAY 6, 2012
The Blackbaud Index of Charitable Giving and The Blackbaud Index of Online Giving provide fundraisers with up-to-date data on fundraising trends and to couple that information with valuable analysis by leaders in the sector. Overall Fundraising Trends. for the 3 months ending March 2012 as compared to the same period in 2011.

Connection Cafe
DECEMBER 4, 2013
GivingTuesday Trends. Online sites, email campaigns, and social media had a much bigger emphasis on #GivingTuesday than in 2012. Online giving on #GivingTuesday 2013 was up 90% compared to 2012. million processed on #GivingTuesday in 2012. Blackbaud processed more than $19.2 This was up from the $10.1

Care2
FEBRUARY 7, 2014
The latest 2013 Charitable Giving Report by Blackbaud analyzed data from more than 4,000 nonprofits to provide the largest analysis in online giving data. in 2013 compared to 2012. Online giving on #GivingTuesday in 2013 was up 90%, compared to 2012. increase from 2012. What trends did your nonprofit notice in 2013?

Care2
FEBRUARY 7, 2014
The latest Blackbaud Online Marketing Benchmark Study for Nonprofits analyzed data from more than 4,000 nonprofits to provide the largest analysis in online giving data. in 2013 compared to 2012 (You can take a look at the review I did of their 2012 study). Online giving on #GivingTuesday in 2013 was up 90%, compared to 2012.

Tech Soup
DECEMBER 11, 2013
GivingTuesday Trends. Online sites, email campaigns, and social media had a much bigger emphasis on #GivingTuesday than in 2012. Online giving on #GivingTuesday 2013 was up 90% compared to 2012. million processed on #GivingTuesday in 2012. Blackbaud processed more than $19.2 This was up from the $10.1

Candid
JULY 27, 2023
2002-2012 – Childhood During the first 10 years, Candid staff primarily focused on collecting grants of $10,000 or more awarded by a sample of the largest U.S. Analysis tip : We still create these annual data sets. Today, we refer to it as the “Foundation 1000”, and it is often used to look at historical grantmaking trends.

Beth's Blog: How Nonprofits Can Use Social Media
NOVEMBER 19, 2013
Alliance Magazine, September 2012. Alliance Magazine, September 2012. Patrick Meier has this excellent “ behind the scenes ” post from April, 2012. He points the common challenge in using social media data for emergency response: scaling. ” Lucy Bernholz, “ Data-first Philanthropy.” Disaster work.

Beth's Blog: How Nonprofits Can Use Social Media
MARCH 18, 2012
GEO’s 2012 National Conference shares a range of perspectives and new ideas for smarter grantmaking that leads to better results and presents opportunities for participants to learn from the wisdom and experience of their peers. The GEO community is united by a common drive to challenge the norm in pursuit of better results.

sgEngage
MAY 1, 2013
For nearly three years now, Blackbaud has continued to expand the number of organizations and giving represented in the analysis. Overall Fundraising Trends. for the 3 months ending March 2013 as compared to the same period in 2012. This is the first negative trend in 6 months. Online Fundraising Trends.

NTEN
JANUARY 8, 2013
[Editor's note: The following is from the December 2012 issue of NTEN:Change , NTEN's quarterly journal for nonprofit leaders. These are just a handful of nonprofit-focused data sharing sites to get you started: National Center for Charitable Statistics: NCCS provides data, as well as analysis tools and reports, on Nonprofits around the US.

Beth's Blog: How Nonprofits Can Use Social Media
OCTOBER 2, 2013
Descriptions of key digital measurement concepts, terminology and analysis techniques. It is also part of another educational technology trend of MOOCs (massively open online courses) which are seeing more widespread adoption in higher education and have become more popular options for online learning.

Beth's Blog: How Nonprofits Can Use Social Media
OCTOBER 17, 2012
Beth Kanter (@kanter) October 4, 2012. If you’ve not seen The Center for Effective Philanthropy survey of September, 2012, it sets up the challenge pretty clearly. ” @ mmorino just finishing up talks in RI/Boston – some great discussions about measurement. What is funder’s role to support good measurement?

sgEngage
DECEMBER 10, 2010
All Blackbaud Blogs Contact Us Blackbaud.com About Nonprofit Trends Books Research Reports Speaking Why Apple isn’t the Nonprofit App Grinch Posted by Steve MacLaughlin on December 10th, 2010 Nonprofit social media expert Beth Kanter isn’t happy with Apple at the moment. Mobile is going to be a huge channel.

NTEN
FEBRUARY 7, 2013
Blackbaud just released the "Charitable Giving Report: How Nonprofit Fundraising Performed in 2012". The report guides you through key statistics and insights into giving trends. Chas Offut has an analysis of 2012 year-end email fundraising and some of the findings may surprise you.

Beth's Blog: How Nonprofits Can Use Social Media
SEPTEMBER 12, 2013
To create the report, an international body of experts in education, technology, and other fields convene on a wiki to review research, practice, and significant trends. The technology trend that caught my eye was “Learning Analytics,” which is big data applied to the field of education. Learning and Knowledge Analytics.

ASU Lodestar Center
SEPTEMBER 14, 2012
While driving to work recently I heard an NPR report about philanthropic giving in the US; but it was not the numbers I had just read in Giving USA 2012 published by the Giving USA Foundation and compiled by the Center on Philanthropy at Indiana University. Sources: [1] Giving USA Foundation, Giving USA 2012, pg. As part of a.

Beth's Blog: How Nonprofits Can Use Social Media
MARCH 4, 2013
In October 2012, the Beth Kanter came to speak to Social Media for Global Health (SM4GH) an interagency working group and space to connect and share experiences around the integrated use of social media to share the messages and products of global health and development organizations. By: Rebecca Shore.
Whole Whale
JUNE 20, 2024
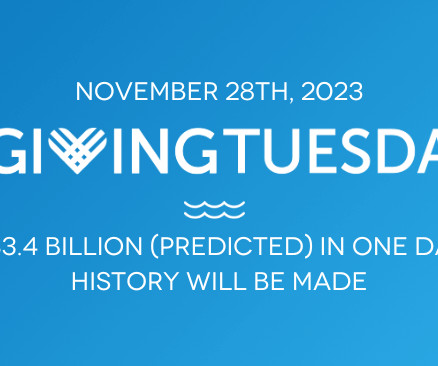
Billion on December 3rd, 2024 Based on our analysis that incorporates an adjusted linear regression, trends in Google Search terms around “Giving Tuesday,” and national giving trends, we predict that $3.5 since 2012. billion, a modest increase of 0.6% from 2022. 34 million adults in the U.S.

Candid
AUGUST 8, 2024
However, the gender pay gap has been gradually declining since 2012 for all but the largest organizations (as measured by budget size). By contrast, at the largest organizations with budgets over $50 million, women represent less than one-third of CEOs and the gender pay gap has worsened since 2012.

Beth's Blog: How Nonprofits Can Use Social Media
JANUARY 8, 2014
Nostalgia is much more than mere reminiscing; it’s a warm, fuzzy emotion that we feel when we think about fond memories from our past. In a 2012 study, researchers discovered that nostalgizing helps people relate their past experiences to their present lives in order to make greater meaning of it all.

Tech Soup
APRIL 23, 2012
comprehensive analysis of online giving trends in the nonprofit sector. behind us, and nonprofits will continue to see positive growth in 2012.” organizations for the first time since Blackbaud began reporting on this trend. Blackbaud recently released its 2011 Online Giving report. billion in total fundraising.

Tech Soup
APRIL 2, 2012
We’ll draw from recent experiences in setting up an active advisory group made up of NGO partners from all corners of the globe; our network-wide campaign to survey NGO technology trends in 24 languages; and, our own technology solution to communicating with these partners to deliver services in 37 countries. Susan Tenby.

Connection Cafe
FEBRUARY 4, 2014
It is the largest analysis of actual overall and online giving data in the nonprofit sector. Overall Giving Trends . on a year-over-year basis for the organizations in the analysis. This was an increase over the 2012 growth rate and points to positive signs that giving in the United States is returning to pre-recession levels.
The NonProfit Times
OCTOBER 8, 2024
The 2024 WGI adds finalized Internal Revenue Service (IRS) data from 2021(the last year for which financial data is available) across 54,588 organizations — providing an analysis on the decade 2012 to 2021 that highlights both gaps and growth in philanthropic support for women and girls. billion.

Whole Whale
NOVEMBER 23, 2022
About Company : Founded in 2012, Google acquired in 2019 for $2.6bn and has included in Google Cloud Platform. About Company : Founded in 2012 as Sonalight, they were taken public in 2021 with a market cap of $7.1bn. Data Set : A data set is a collection of data that can be used for analysis. Mixpanel – Wikipedia.
Forum One
MAY 3, 2023
To achieve this, Forum One conducted a comprehensive landscape analysis and full audits of their technical ecosystem, communications, and analytics as well as stakeholder interviews.

Tech Soup
NOVEMBER 15, 2011
” In other words, if the new PC market grows by by 9% worldwide in 2012 as is forecast by the business research firm IDC , then the used PC market will grow as well. Thus, it continues the decades-long trend that IT spending has an increasing share of the global economy. Refurbishment and the Environment.

Connection Cafe
DECEMBER 31, 2013
Back by popular demand was Steve MacLaughlin’s analysis of the 200 email subject lines sent to him from nonprofits between December 1, 2012 and December 31, 2012. The result: Fundraising Ideas to Reverse the Trend of Declining Email Response Rates.

Connection Cafe
JANUARY 1, 2014
This is the 2013 edition of my annual review of year-end email subject lines that started in 2011 and continued in 2012. Here are some insights, trends, and the complete list of email subject lines. Most nonprofits in the analysis followed a pattern of sending most emails between Tuesday and Thursday throughout December.
Forum One
DECEMBER 13, 2023
Since 2012, Educational Testing Service (ETS) has engaged Forum One to design and build more engaging, interactive reports to share the NAEP results, including the most recent 2022 Nation’s Report Cards for Mathematics and Reading , with data at the national, state, and district levels.

Connection Cafe
FEBRUARY 2, 2015
It is the largest analysis of actual overall and online giving data in the nonprofit sector. Overall Giving Trends. Online Giving Trends. despite the absence of the high profile episodic events that drove an increase in giving in both 2013 and 2012. In 2014, overall charitable giving in the United States increased 2.1%

Connection Cafe
JUNE 16, 2016
Macroeconomic Trends. for three of the four years between 2012 and 2015. The new trends reported by Giving USA are helpful to understand changes in the nonprofit giving landscape. This is based on an analysis of $19.7 Giving to foundations has grown the least over a 2-year time period with 2.8% in 2000 and as low as 1.7%
Expert insights. Personalized for you.
We have resent the email to
Are you sure you want to cancel your subscriptions?


Let's personalize your content