article thumbnail

MatrixMaxx 24.1 Release is Full of Visualizations and Dashboard Enhancements

The MatrixFiles

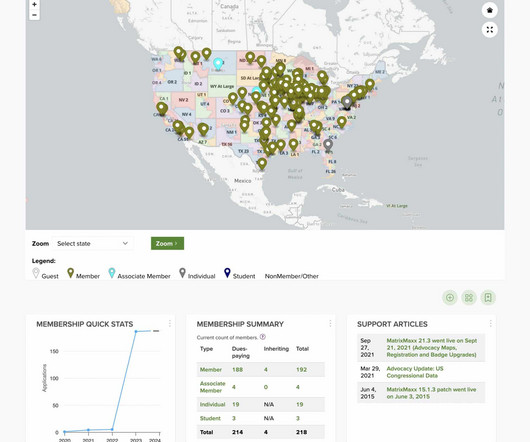
Membership Churn, in particular, charts members lost over a specific time period, providing a crucial metric alongside membership retention. Charting Churn to measure membership turnover offers a high-impact way to see how well your retention efforts are working.

Module 130
article thumbnail

Get Your Small Business on the Map: 5 Digital Marketing Tips

Nonprofits Source

Whether you own a pet-care business , bookstore, or flower shop, these five tips will help put your small business on the digital map. Remember to choose the communication channels your audience is already familiar with, and chart a customer journey that moves each prospect carefully down the sales funnel.

Map 52
professionals

Sign Up for our Newsletter

This site is protected by reCAPTCHA and the Google Privacy Policy and Terms of Service apply.

article thumbnail

Information: The Better Half of IT

sgEngage

As a Database Administrator, my world revolves around helping users make sense of the information they receive, from voice-of-the-customer anecdotes and impressions to polished Key Performance Indicator (KPI) graphs, charts, and dashboards. Data gives us context. How do I care for my data? That’s okay!

Chart 87
article thumbnail

5 Tips for Community Health Centers to Transition to New Fund Accounting Software

sgEngage

It will help you envision the ease of an optimized structure for your chart of accounts and the business rules that will be most beneficial. This enables the vendor to account for everything and map your history to a new and optimized chart of accounts. Determine the non-financial metrics you want to track.

Fund 94
article thumbnail

If a Metric Changes on a Spreadsheet and No One Notices, Does it Show Impact?

Amy Sample Ward

Give me an interactive map, a pivot table, even a plain old pie chart and I’m happy. Establishing regular meetings or processes for metrics review helps position us to learn from the data we’re collecting and be better positioned to identify opportunities to improve. Is data helpful if you can’t change it?

Metrics 158
article thumbnail

Blackbaud Discontinued Crystal Reports – Now What?

Cloud 4 Good

When configured correctly, Tableau dashboards can support your fundraising team members through greater self-service access to reports and data analysis, distributing the understanding of your key metrics across the organization far more efficiently. .

article thumbnail

Nonprofit Finance Leaders: Don’t Miss These bbcon 2023 Sessions

sgEngage

From Chart Organizers to Dashboards, you’ll leave with practical ways you can automate and simplify your fund accounting. Improving Business Process with Process Maps : Is it really an improvement if you can’t measure the impact? They need information that helps them make data-driven decisions.